Stream Nginx and PHP FPM logs into AWS cloudwatch
When you have a web application running on AWS instances, you may have control over some cloud monitors of the instances such as Memory Usage, CPU Utilization or even metrics related to storage space. But :
- What if you want to have your nginx and PHP FPM logs steamed on AWS?
- You want to set up a cloudwatch alarm if nginx throws an error?
- You have an autoscaling setup and you want to steam nginx logs of all servers at a central log group on cloudwatch?
- You do not want to incorporate any 3rd party monitoring tool and want to stick to AWS?
- Last but not the least, you want it to be cost effective as logs are going to pile up as time goes?
Well, this is all possible now! Let's find out how...
AWS Cloudwatch Agent :
The first and very basic question comes to mind when streaming any custom log file into AWS cloudwatch is : How I am going to stream the logs continously to AWS cloudwatch The answer is using AWS Cloudwatch Agent
On a broader level, once you install AWS Cloudwatch Agent on your EC2 instance, it's going to have a service called awslogs available for you. This service is responsible for streaming any log file you wish to track on AWS cloudwatch. This service will take care of how to push the logs, how much log buffer to push at a time, how much kbs of data to push at a time and so on.
As any unix service would have, the awslogs service also has very handy configuration file using which you can tweak the above parameters which contribute to pushing the log stream into AWS cloudwatch.
Giving permissions to push to cloudwatch :
When we have the AWS Cloudwatch agent installed and the awslogs service running, you will expect the log streaming on AWS cloudwatch inside AWS region you specified. But, it will not work directly.
This is because, the instance should have permission to push logs into cloudwatch. For this we will create a new policy called AWS-cloudwatch-agent-policy.
- Login to AWS Console and go to
IAMservice. - Go to
Policiesfrom the L.H.S. menu - Click on
Create Policy - A visual editor for policy will be shown. But we are going to save time here. Click on the
jsontab and enter following json in there :
{
    "Version": "2012-10-17",
    "Statement": [
        {
            "Effect": "Allow",
            "Action": [
                "logs:CreateLogGroup",
                "logs:CreateLogStream",
                "logs:PutLogEvents",
                "logs:DescribeLogStreams"
            ],
            "Resource": [
                "arn:aws:logs:*:*:*"
            ],
            "Condition": {
                "StringEquals": {
                    "aws:RequestedRegion": "xx-xxxx-x"
                }
            }
        }
    ]
}
Make sure you replace xx-xxxx-x with the region you want to steam logs into. e.g. us-west-1
5. Click on Review Policy
6. Give Name as AWS-cloudwatch-agent-policy. If you want to be specific(which I would recommend), add the region name in there e.g. AWS-cloudwatch-agent-policy-us-west-1
7. Give Description and click on Create Policy
Now, we have the policy ready. We need to attach this policy to an IAM User or IAM Role so that EC2 instance can stream logs into AWS cloudwatch. There are 2 ways to do it :
A. If your EC2 instance is having an instance IAM role attached to it, then simply attach this policy to that role. You can find this by going into EC2 instances section and looking for instance property called IAM Role.
OR
B. If you do not have any IAM role attached to your instance, then create a new IAM user with name AWS-cloudwatch-agent-user with ONLY programatic access enabled. Then attach the policy we created above to this user. Make sure you save the Access Keys and Secret Access Keys for this user. We will need it shortly.
Installing the agent :
Now that we have the permissions sorted out, let's install AWS cloudwatch agent, which is the easiest task to do. I am using an ubuntu EC2 instance so I will follow the steps relevent to it in this article. If you are using any other operating systems, feel free to visit the installation documentation
- SSH into your ubuntu EC2 instance
- Run following commands :
# Switch to root user
sudo -s
# Update the packages
apt-get update -y
# Download the ubuntu cloudwatch agent setup file
cd /root
curl https://s3.amazonaws.com/aws-cloudwatch/downloads/latest/awslogs-agent-setup.py -O
# Install the cloudwatch agent
# Make sure you replace xx-xxxx-x with your region e.g. us-west-1
sudo python ./awslogs-agent-setup.py --region=xx-xxxx-x
- Once you run the
awslogs-agent-setup.py, it will ask you couple of questions in the prompt like below :
When it will ask for AWS Access Key ID & AWS Secret Access Key, if you have chosen the option A in previous section which is using IAM Role of the instance, then press continue(enter) without anything. If you have chosen the option B which is using an IAM User with programatic access, add the AWS Access Key ID & AWS Secret Access Key of that user and then proceed with the prompt.
On the remaining prompt, just follow what we have below. We will just start with basic bare bones because, we are going to update these settings from config file in next step.
Step 1 of 5: Installing pip ...libyaml-dev does not exist in system DONE

Step 2 of 5: Downloading the latest CloudWatch Logs agent bits ... DONE

Step 3 of 5: Configuring AWS CLI ...
AWS Access Key ID [None]:
AWS Secret Access Key [None]:
Default region name [us-west-1]:
Default output format [None]:

Step 4 of 5: Configuring the CloudWatch Logs Agent ...
Path of log file to upload [/var/log/syslog]:
Destination Log Group name [/var/log/syslog]:

Choose Log Stream name:
  1. Use EC2 instance id.
  2. Use hostname.
  3. Custom.
Enter choice [1]: 1

Choose Log Event timestamp format:
  1. %b %d %H:%M:%S    (Dec 31 23:59:59)
  2. %d/%b/%Y:%H:%M:%S (10/Oct/2000:13:55:36)
  3. %Y-%m-%d %H:%M:%S (2008-09-08 11:52:54)
  4. Custom
Enter choice [1]: 3

Choose initial position of upload:
  1. From start of file.
  2. From end of file.
Enter choice [1]: 2
More log files to configure? [Y]: N

Step 5 of 5: Setting up agent as a daemon ...DONE


------------------------------------------------------
- Configuration file successfully saved at: /var/awslogs/etc/awslogs.conf
- You can begin accessing new log events after a few moments at https://console.aws.amazon.com/cloudwatch/home?region=us-west-1#logs:
- You can use 'sudo service awslogs start|stop|status|restart' to control the daemon.
- To see diagnostic information for the CloudWatch Logs Agent, see /var/log/awslogs.log
- You can rerun interactive setup using 'sudo python ./awslogs-agent-setup.py --region us-west-1 --only-generate-config'
Testing the initial setup :
Let's first check if the awslogs service is running :
sudo service awslogs status
This should show as active.
Now let's see if our instance is streaming anything :
sudo tail -f /var/log/awslogs.log
You should either see something like cwlogs.push.publisher which is publishing log successfully. If you have any issue with permissions, you should see the error here.
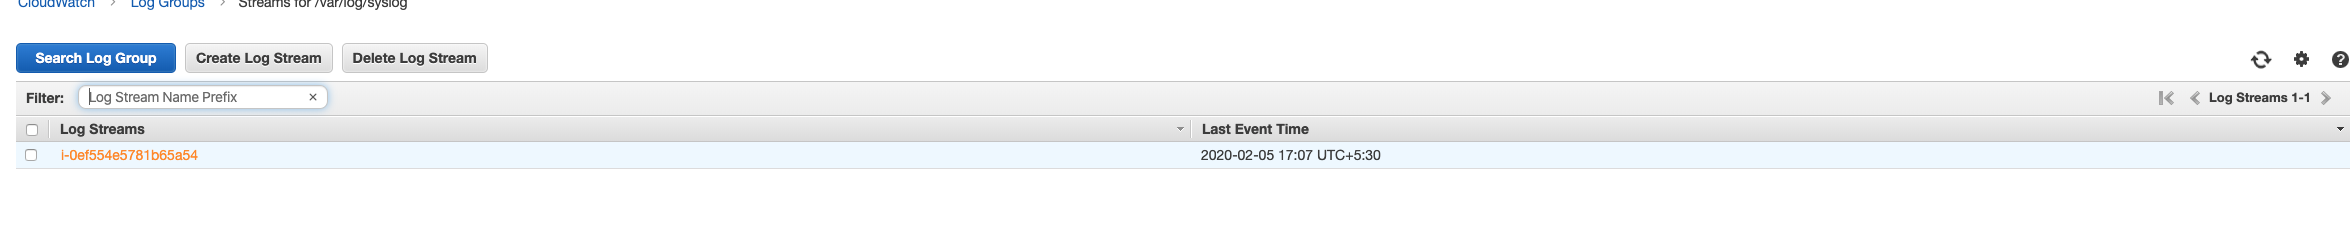
If everything is working, you should see a log group called /var/log/syslog when you visit https://console.aws.amazon.com/cloudwatch/home?region=xx-xxxx-x#logs: where xx-xxxx-x is your AWS region. If you click on the log group, you should see syslogs streaming in there. whohooo!

Updating the configurations :
Let's first stop the awslogs service for a moment to avoid any syslogs steaming into AWS cloudwatch.
sudo service awslogs stop
Now, we are going to update the configuration file /var/awslogs/etc/awslogs.conf. Edit this file and add below contents in it :
[general]
state_file = /var/awslogs/state/agent-state

[nginx]
file = /var/log/nginx/error.log
log_group_name = nginx_error_logs
log_stream_name = {instance_id}-{hostname}
datetime_format = %b %d %H:%M:%S
initial_position = end_of_file

[phpfpm]
file = /var/log/php7.2-fpm.log
log_group_name = php_fpm_logs
log_stream_name = {instance_id}-{hostname}
datetime_format = %b %d %H:%M:%S
initial_position = end_of_file
Note : Make sure you verify the log file paths as per your server settings.
Let's quickly go over what we have set. The general section is what this service needs to keep its state intact. We have kept it as it is.
The next 2 sections nginx and phpfpm will stream the logs.
1. file : The absolute path of the respective log file
2. log_group_name : Log group which will cloud all similar logs together in AWS cloudwatch
3. log_stream_name : The name of the stream of this log group pushed from an instance
4. datetime_format : The format of logged timestemp
5. initial_position : If you would like to stream the new lines from end of the time or from begining of the file(start_of_file)
If you wish to know more about these options, visit this documentation
Once you save this file, start the awslogs service :
sudo service awslogs start
Finally, you will now see nginx and phpfpm logs steaming into your AWS cloudwtch logs in their respective log groups.
Avoiding streaming of notices and warnings :
At this point in your setup, the awslogs service will stream every log entry from the files you are streaming, no matter if it's an info, notice, warning or an error.
You would not want to pile up your AWS cloudwatch logs with anything which you do not want to track. You can get around this from choosing either of below options :
A. Updating nginx and php fpm service configurations and making sure their log levels are set just to log errors or warnings if you want.
B. You can use the awslogs configuration option called multi_line_start_pattern where you can specify a regex which will determine the start of the line.
Setting up a cloudwatch alarm :
Now that we have the nginx and phpfpm logs into AWS cloudwatch, it's time to do the main step. Let's set up an alarm.
- Login to AWS Console and go to
Cloudwatchservice. - Go to
Alarms > Alarmfrom the L.H.S. menu - Click on
Create Alarm - Click on
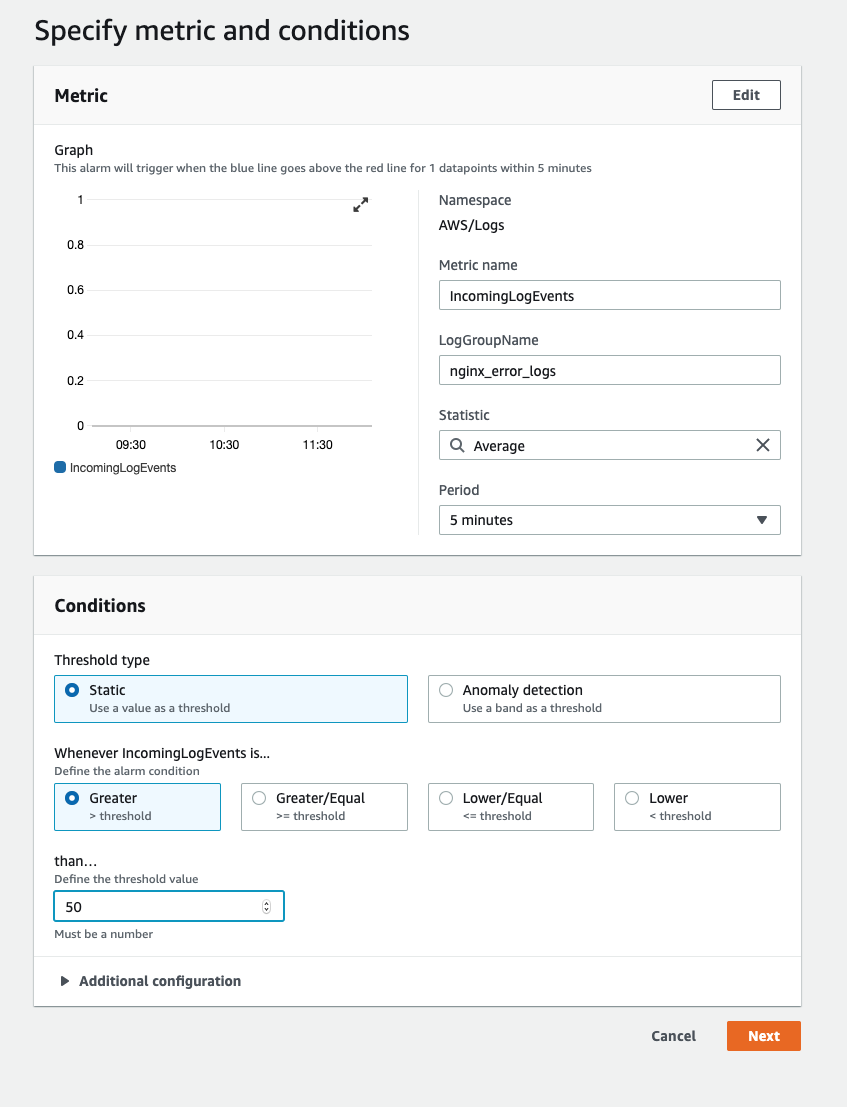
Select Metricand search forLog Group, you will seeLogs > Log Group Metrics, select that - From
LogGroupName, select the log group you want to monitor. You should seenginx_error_logsandphp_fpm_logsin the listing, choose any one of them - You will see the screen where we specify the alarm conditions. You can set duration of 5 minutes for a static threshold when incoming logs are greater than 50. This means that if for a period of 5 minutes, if any of the log group we select have more than 50 logs, this alarm will go on.
Pricing :
The AWS cloudwatch agent is free because it's a native service running on your instance. However, what you pay is for the amount of logs you collect, stream and store over AWS cloudwatch. You can check the pricing from their documentation. However, you will find it's much cheaper than most of the 3rd party services providing similar log monitoring service.
Final words :
It's said that you can spread over different cloud providers or service providers to explore more. But in my experience, AWS has these native options which are cost effective, easy and standard to set up.. Plus you have everything in one console, you should definitely give it a try before shifting to a 3rd party solution implementing the same thing.